BTP Underwriting
Overview
- Product: Unified underwriting workspace for evaluating complex risk
- Problem: Risk data was fragmented across multiple systems, slowing analysis and increasing friction
- Impact: Streamlined workflows, reduced context switching, and improved the speed and clarity of risk decisions
Role & Scope
- Designed a new underwriting workspace to unify fragmented risk data
- Defined interaction patterns for evaluating complex, multi-source inputs
- Partnered with product and engineering to structure workflows and system behavior
- Delivered a solution that reduced friction and improved clarity in risk decision-making
The Problem
- Underwriters spent significant time tracking down and verifying data across multiple systems
- Information had to be manually pieced together, often requiring duplicate checks for accuracy
- Fragmented workflows introduced friction and slowed down even straightforward evaluations
- Inconsistent processes made risk assessment less reliable and harder to scale
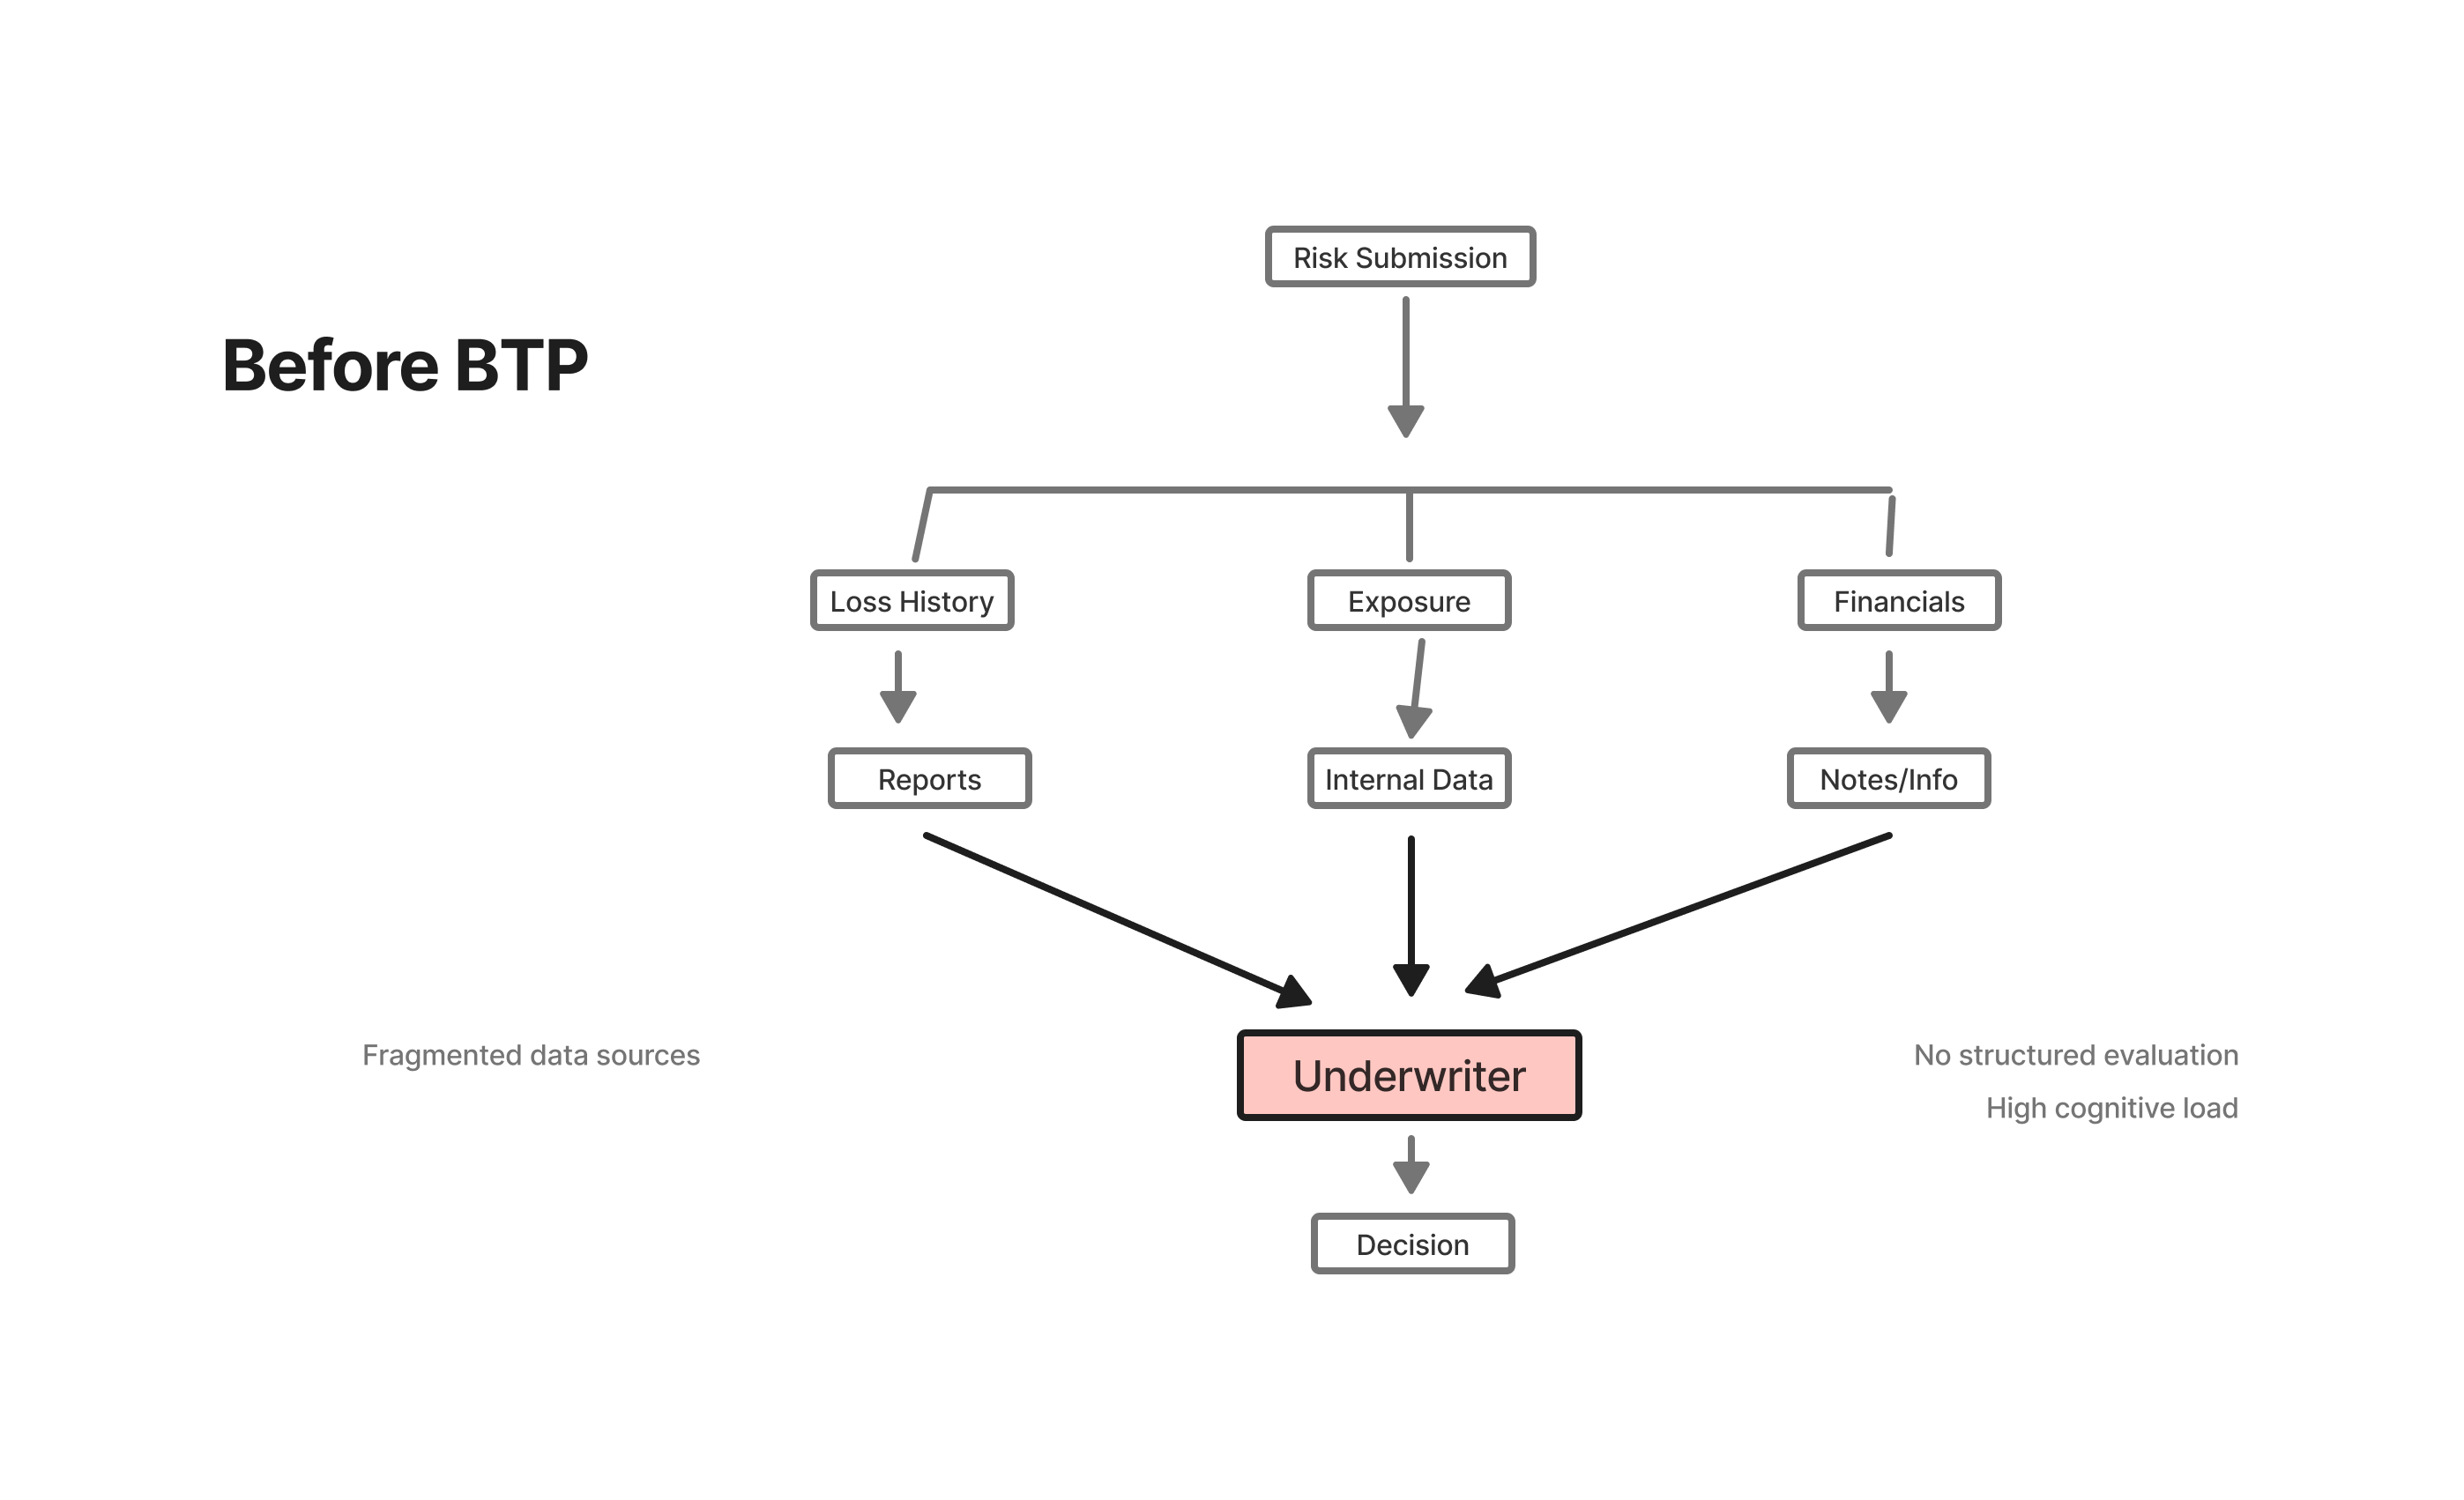
From Fragmented Inputs to Structured Evaluation
Underwriters spent significant time gathering and verifying risk data across disconnected sources before they could begin evaluation.
Key Decisions
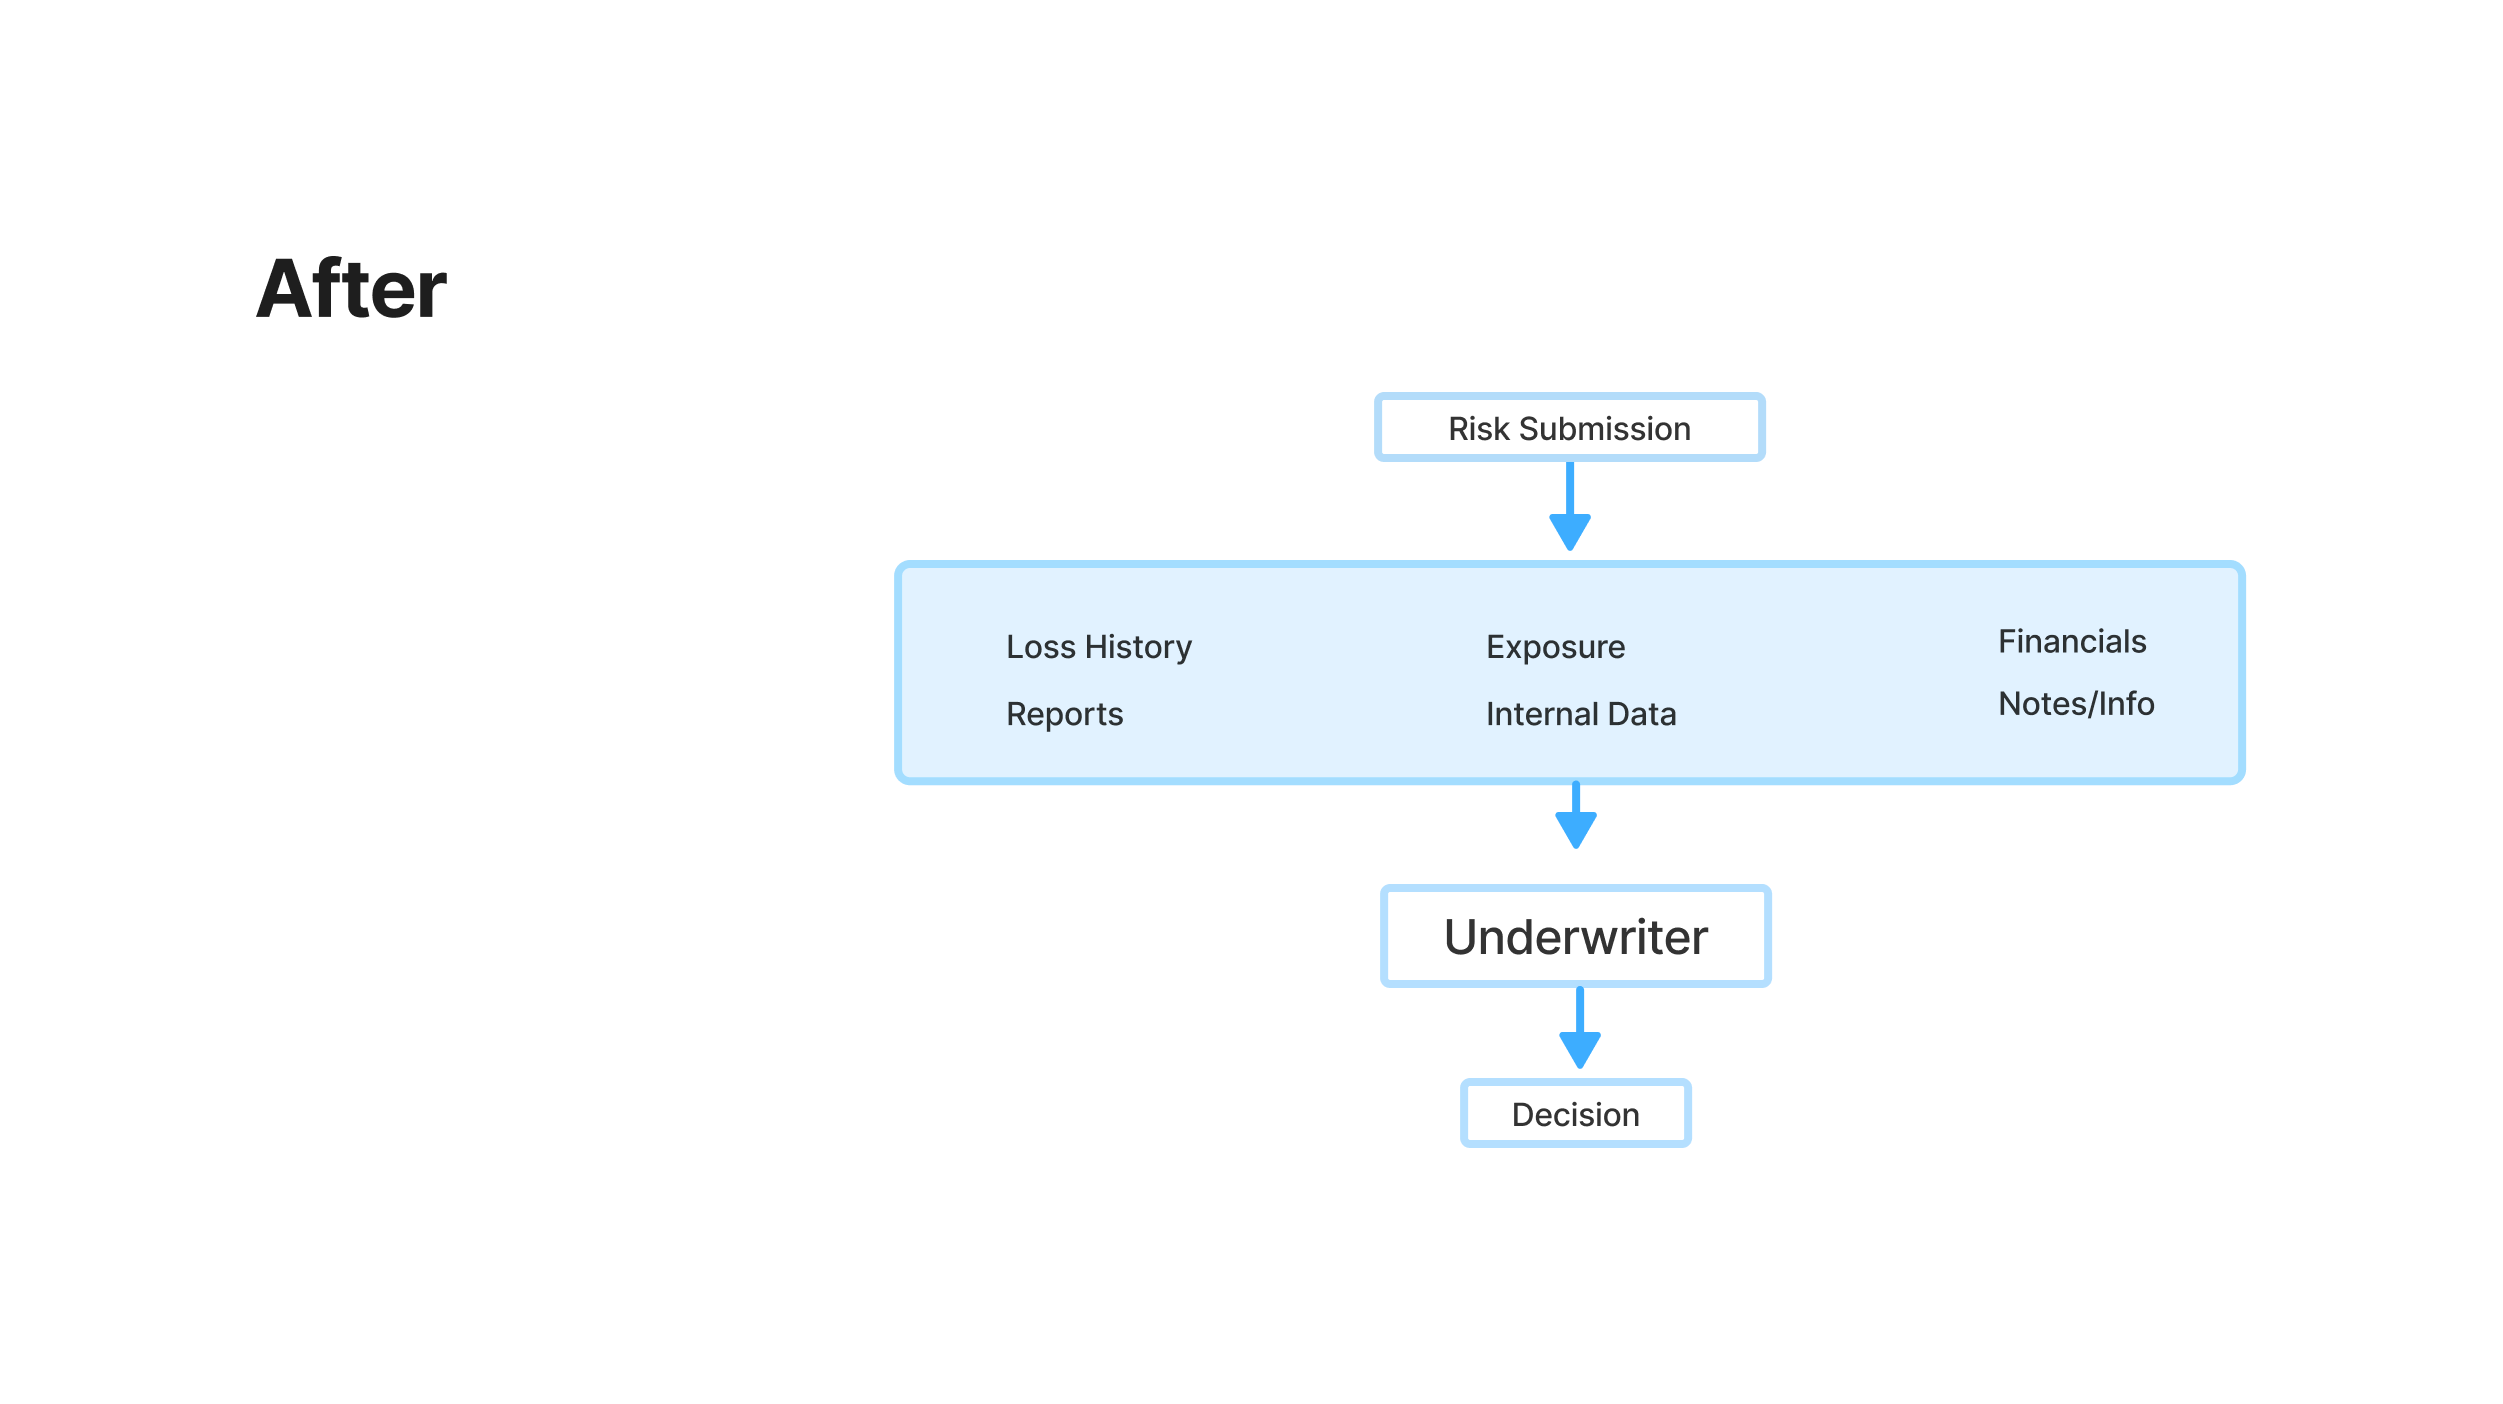
- Unified workflow: Consolidated disconnected tools into a single evaluation flow, reducing the need to gather data across systems
- In-place data interaction: Enabled calculations and validation directly within data inputs, eliminating the need to leave the workflow
- Contextual data integration: Combined topographical and natural hazard data into a single view to support more informed risk evaluation
- Structured continuity: Introduced a notes system to capture context, supporting handoffs and preserving decision history
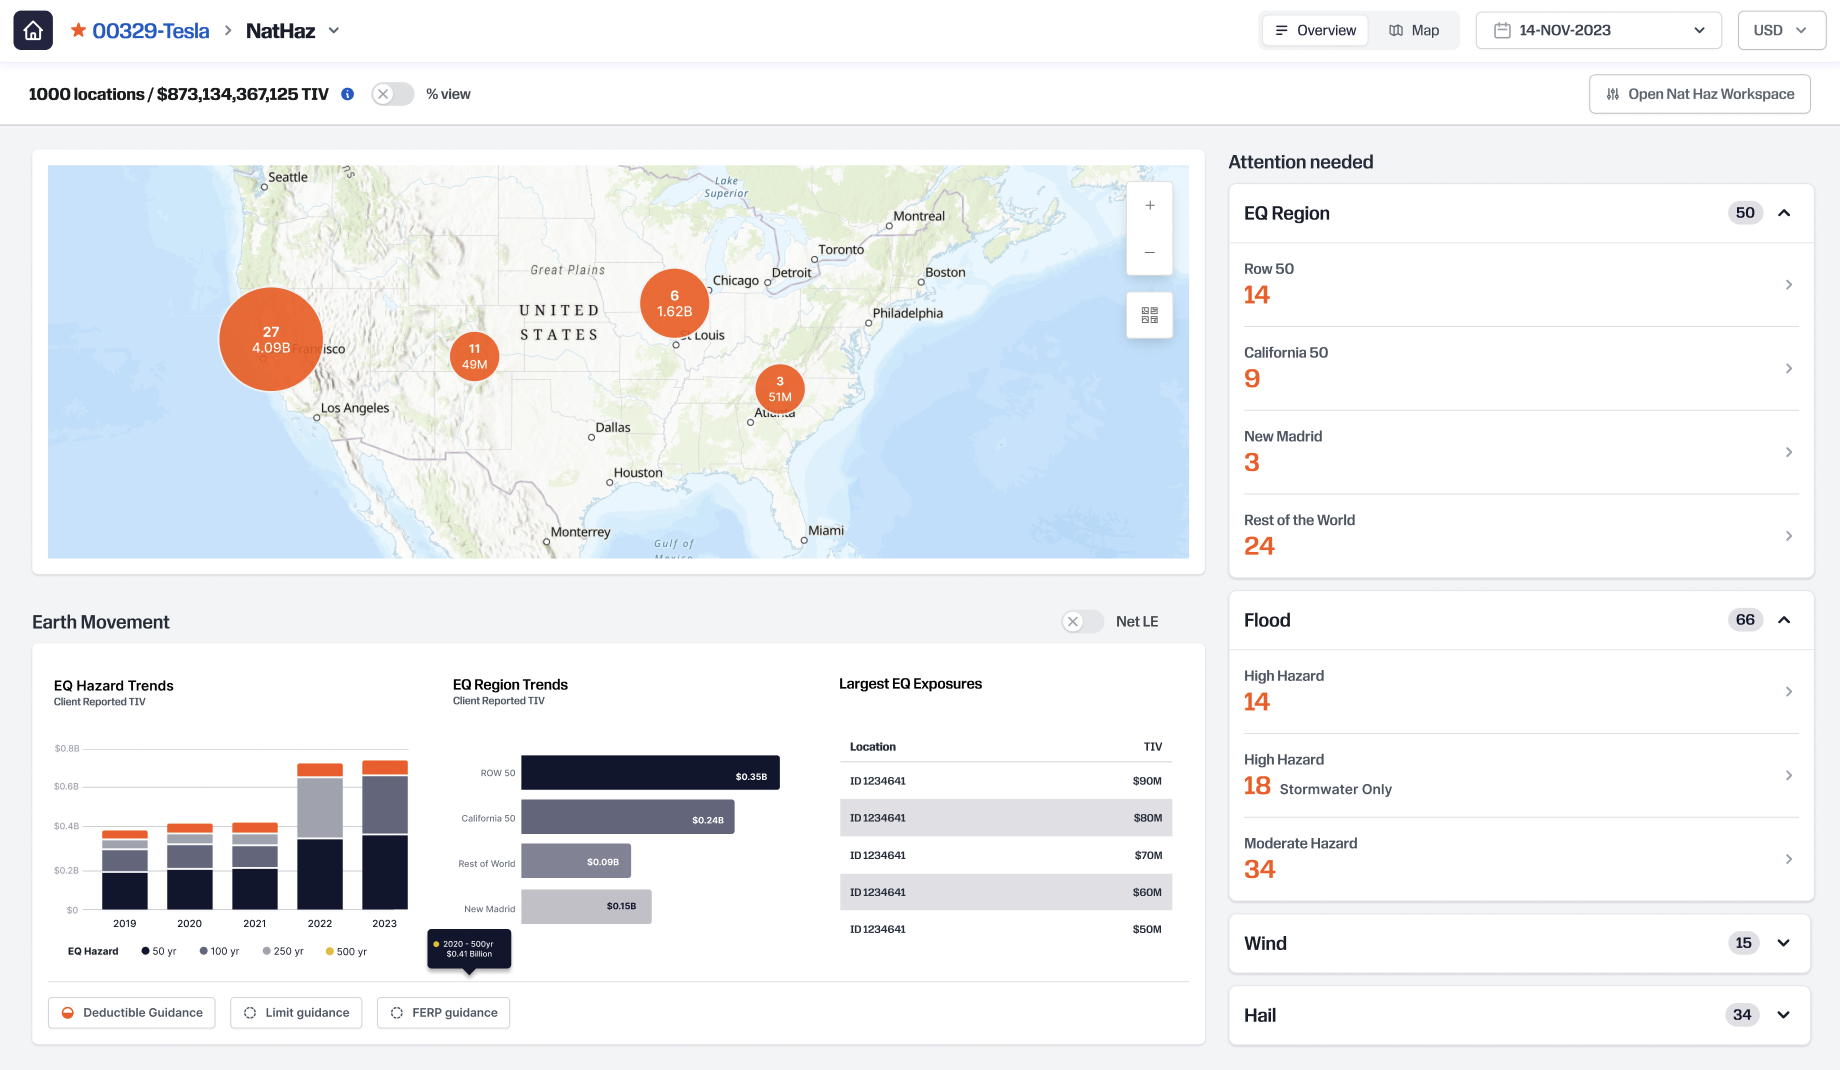
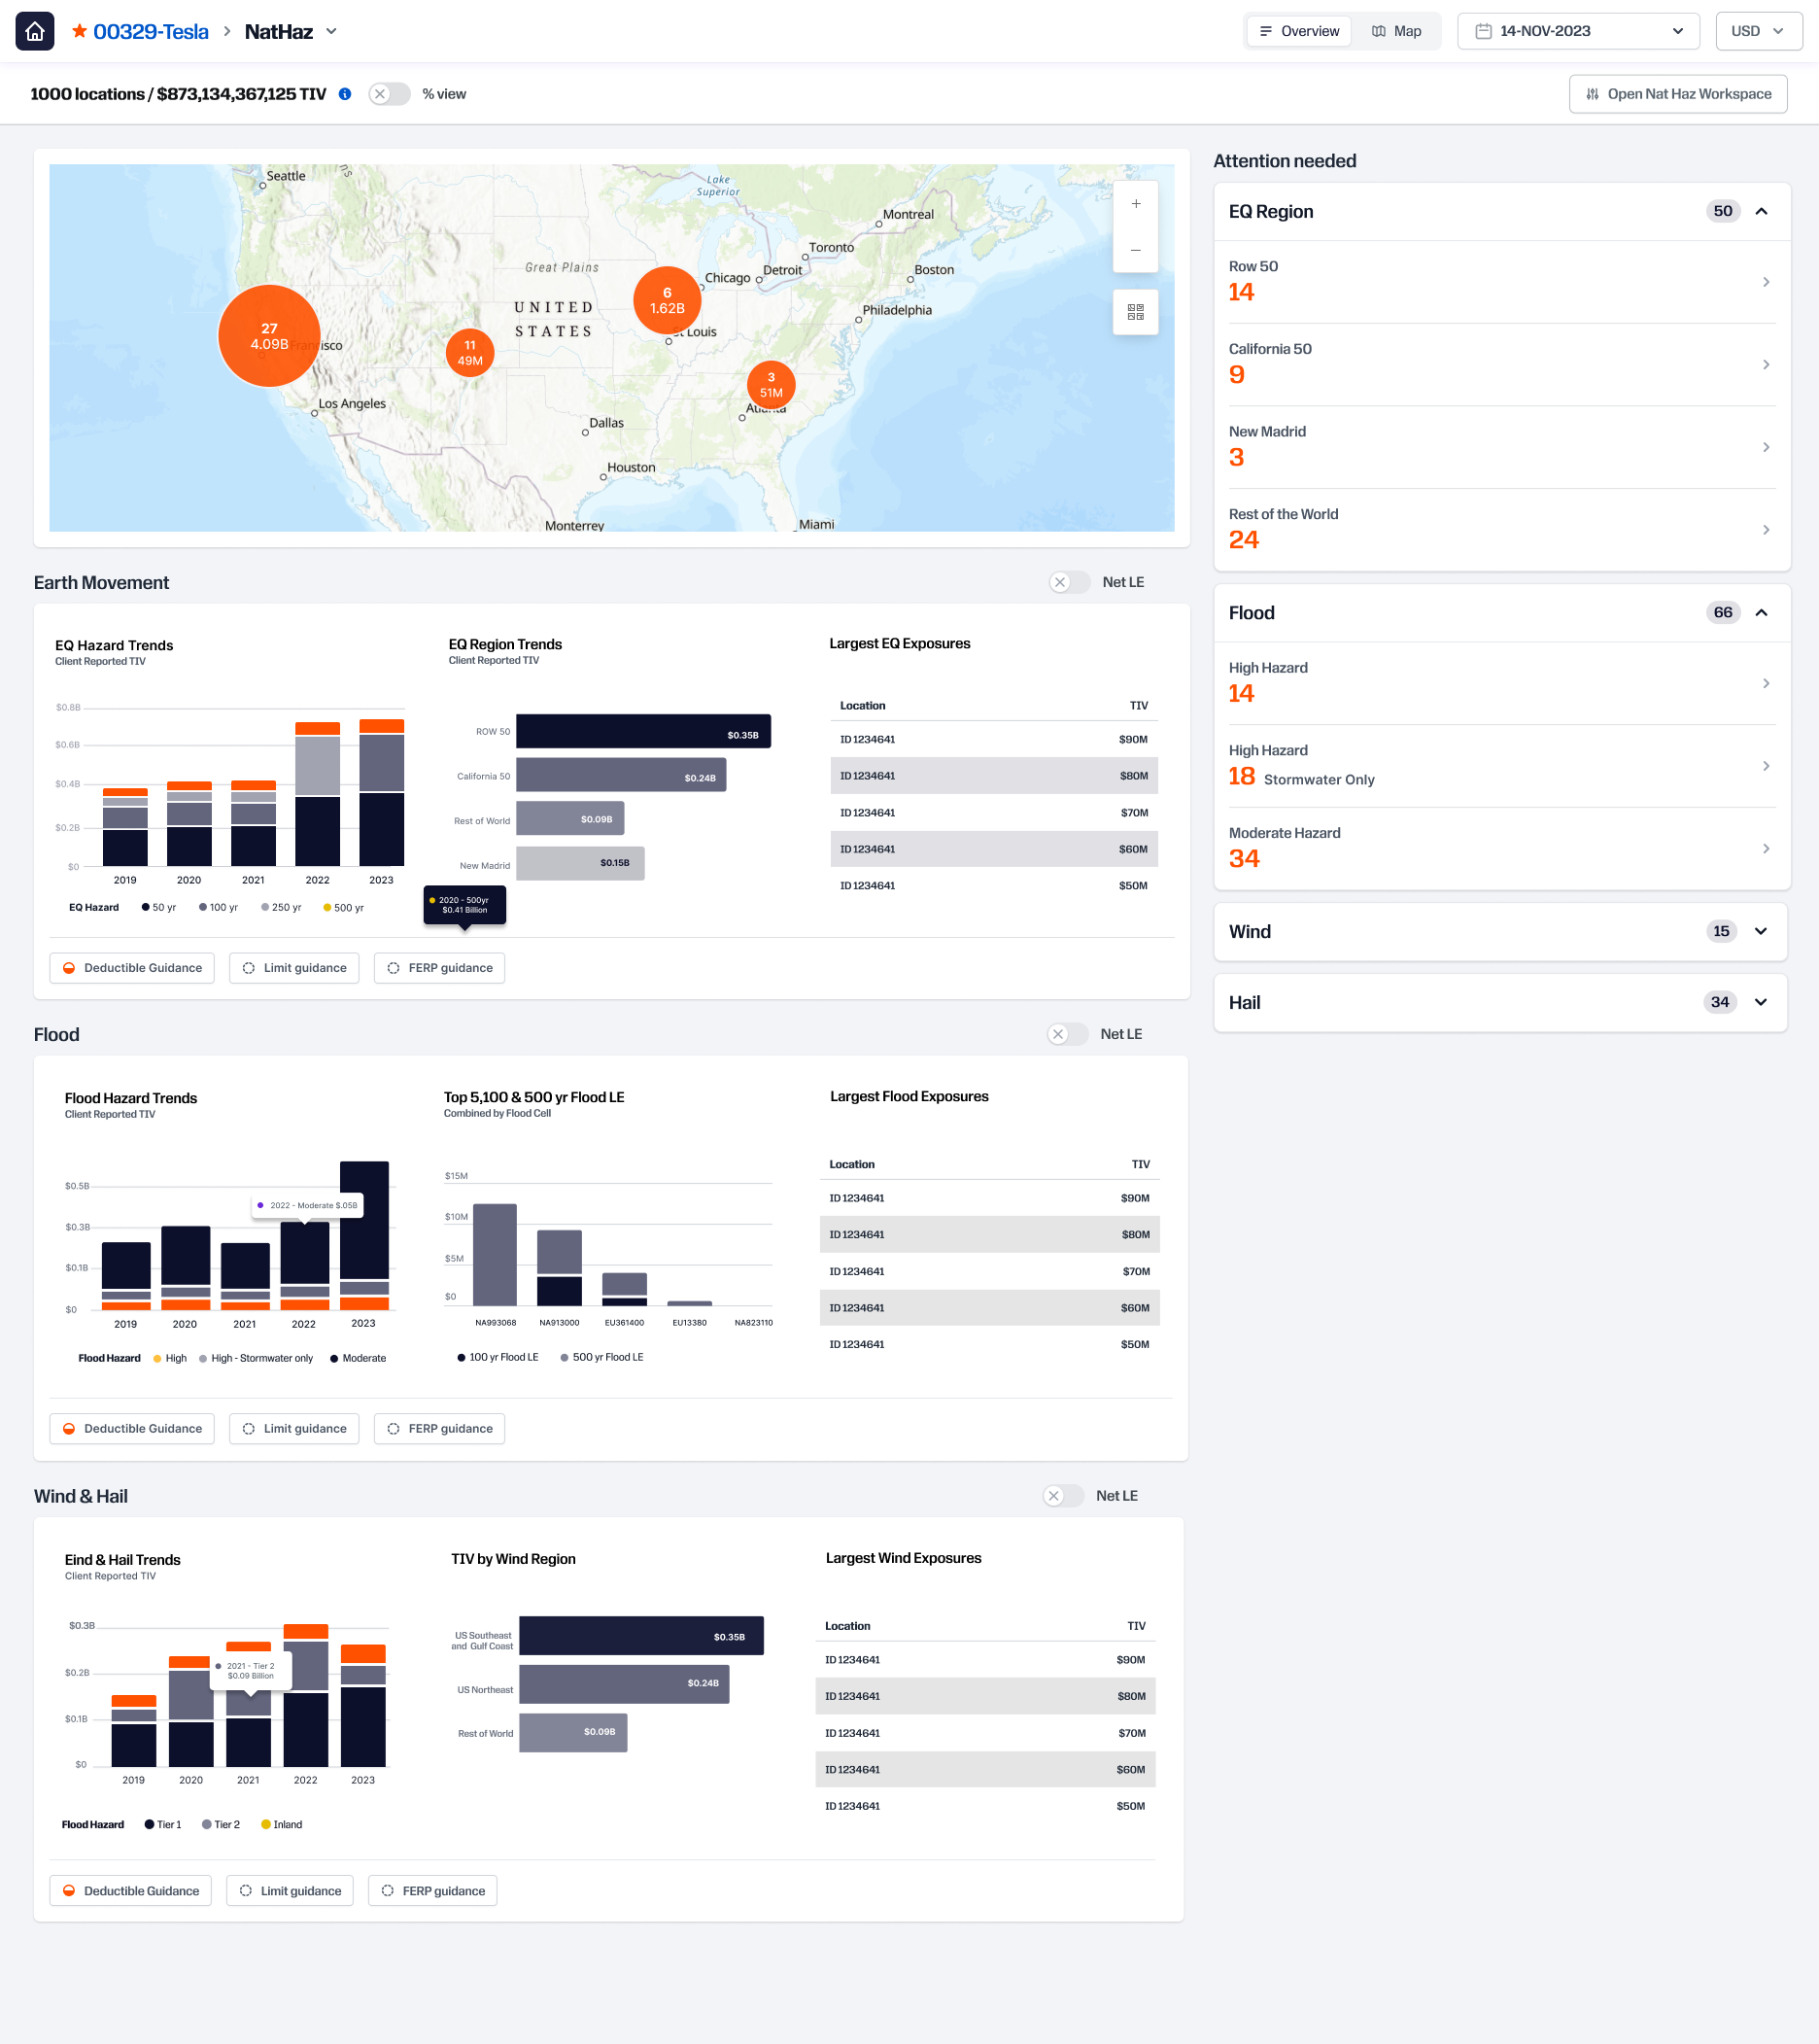
Example — Risk Overview
- Combines geographic data, hazard exposure, and trend analysis into a single view
- Enables underwriters to quickly assess risk without switching between systems
- Supports movement from high-level overview to detailed analysis without losing context
Inline Editing & Validation
Reducing Friction
- Underwriters frequently left the workflow to validate and double-check data
- Introduced in-place editing within the table to keep validation inside the workflow
- Anchored a side panel to the table, allowing users to review and update multiple records without losing context

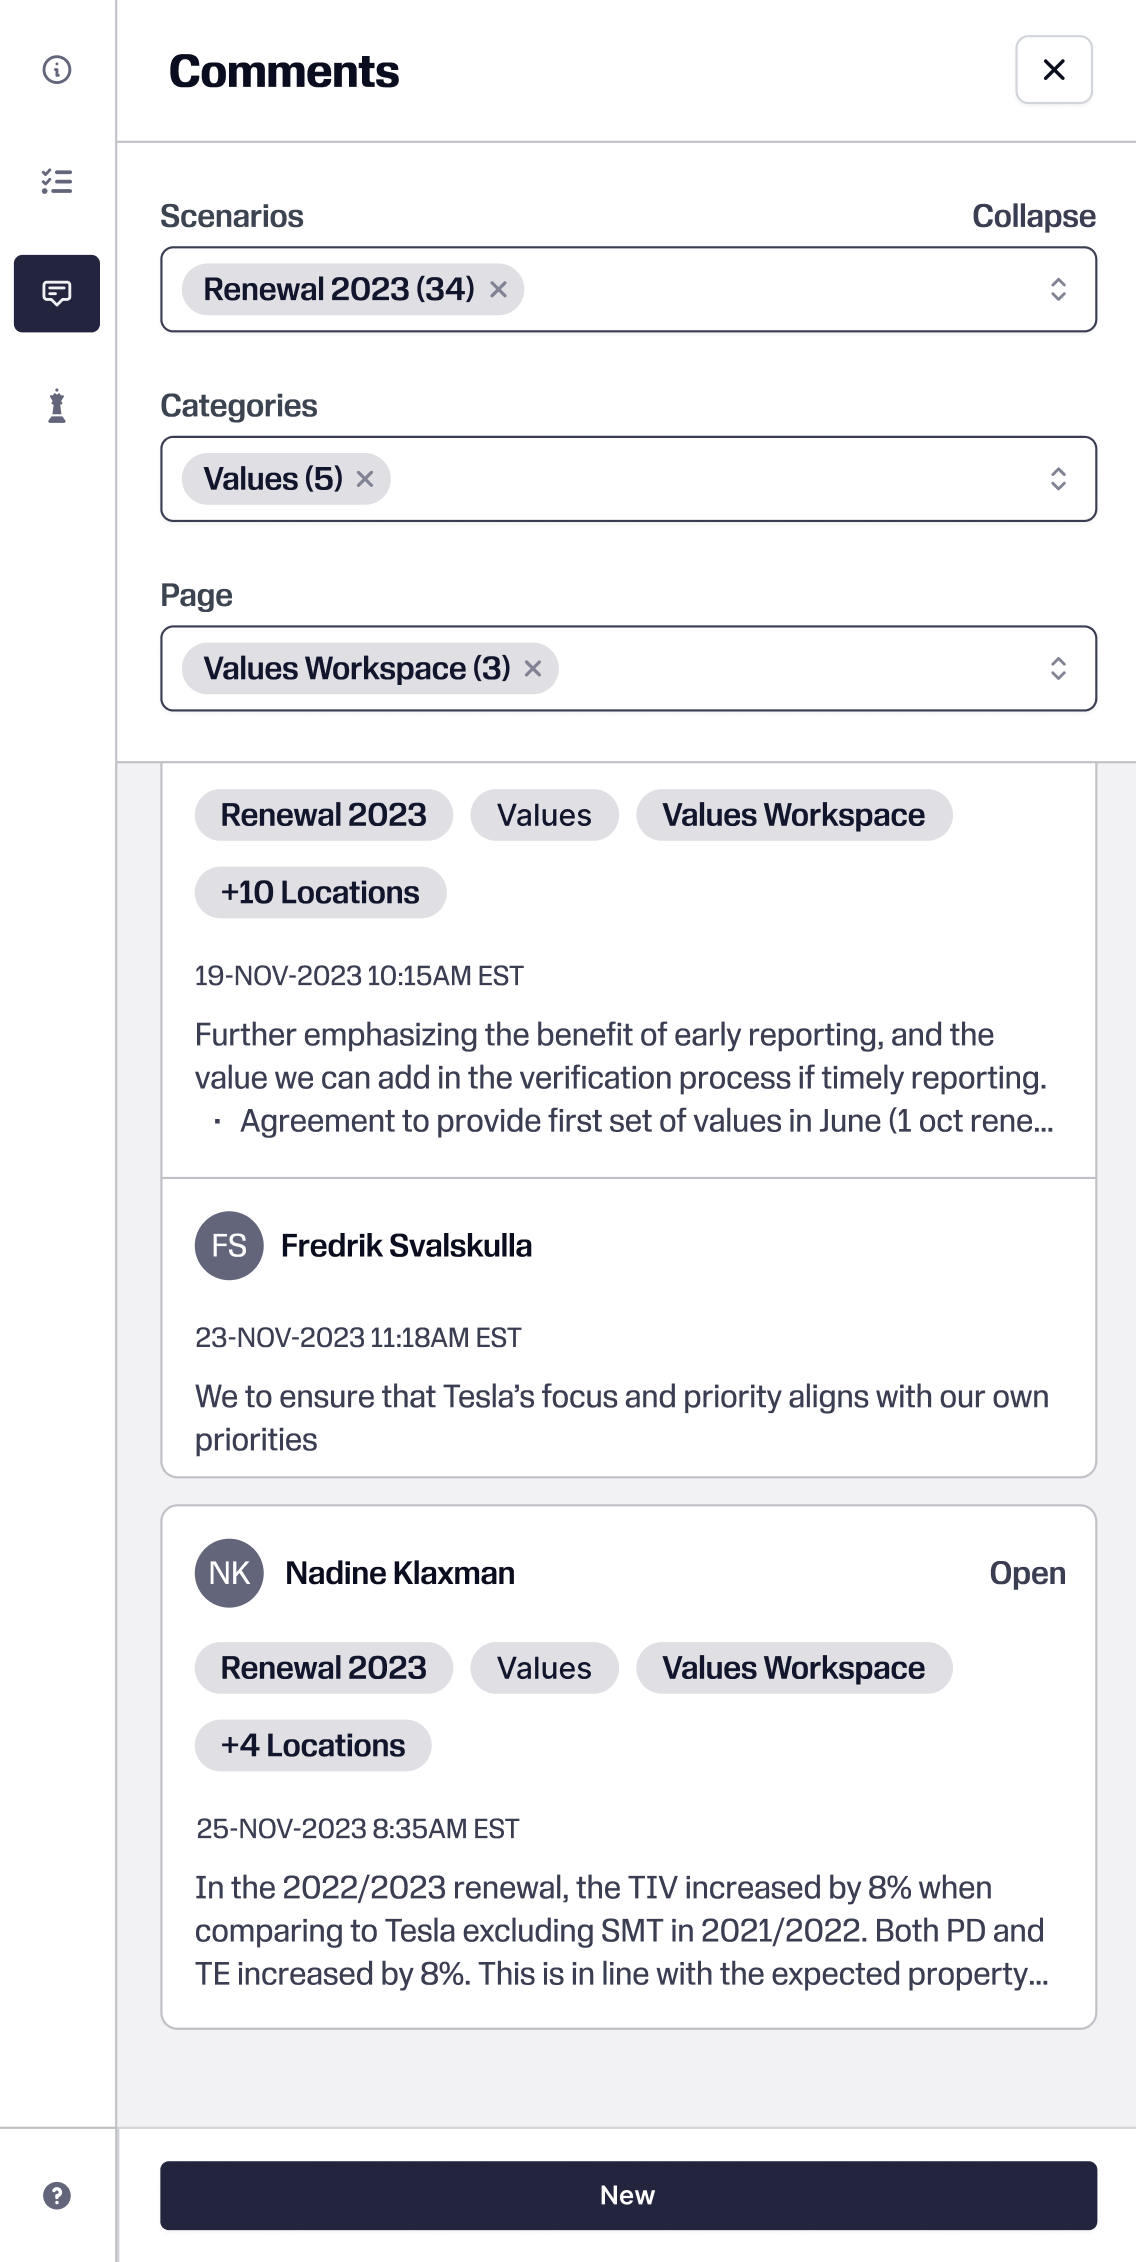
Structured Context, Not Just Notes
- Accounts were passed between underwriters, often without clear context on prior decisions
- Introduced structured notes tied directly to accounts, workflows, and scenarios
- Enabled search and filtering to quickly surface relevant context without digging
Decision Continuity
- Context remained tied to the work instead of living in separate threads
- Supported handoffs and made it easier to understand how decisions evolved over time
Outcome
The result was a more cohesive underwriting workflow. What used to require jumping between systems became a simpler, more direct evaluation process.